Getting Started
What R is, how to install it, and how to run your first commands
What Is R?
R is a free, open-source programming language for statistics, data analysis, and visualization. Instead of clicking through menus and typing formulas into cells (as in Excel), you write short instructions — code — that R runs for you.
Most of this site uses the tidyverse: a collection of R packages (such as dplyr, ggplot2, and readr) built to work together with a consistent, readable style. It makes the common data tasks — importing, tidying, summarising, and plotting — approachable for beginners.
Why R instead of Excel?
- Reproducible — your whole analysis is a script you can re-run and share, and anyone gets the same result.
- Fewer hidden errors — every step is written down, not hand-edited in cells you cannot audit later.
- Scales to real data — R handles large, messy datasets far beyond a spreadsheet’s comfort zone.
- Free and widely used — standard across pharmaceutical sciences, research, and industry.
- Publication-quality plots — flexible, repeatable figures produced straight from your code.
Installing R and RStudio
To follow along locally you need two free pieces of software:
- R — the language itself. Download from cran.r-project.org.
- RStudio — the editor (IDE). Download from posit.co/download/rstudio-desktop.
Install R first, then RStudio.
TipNo installation needed on this site
Executable code blocks on this site run live in your browser via webR. Click Run Code to execute — no R or RStudio required.
The RStudio interface
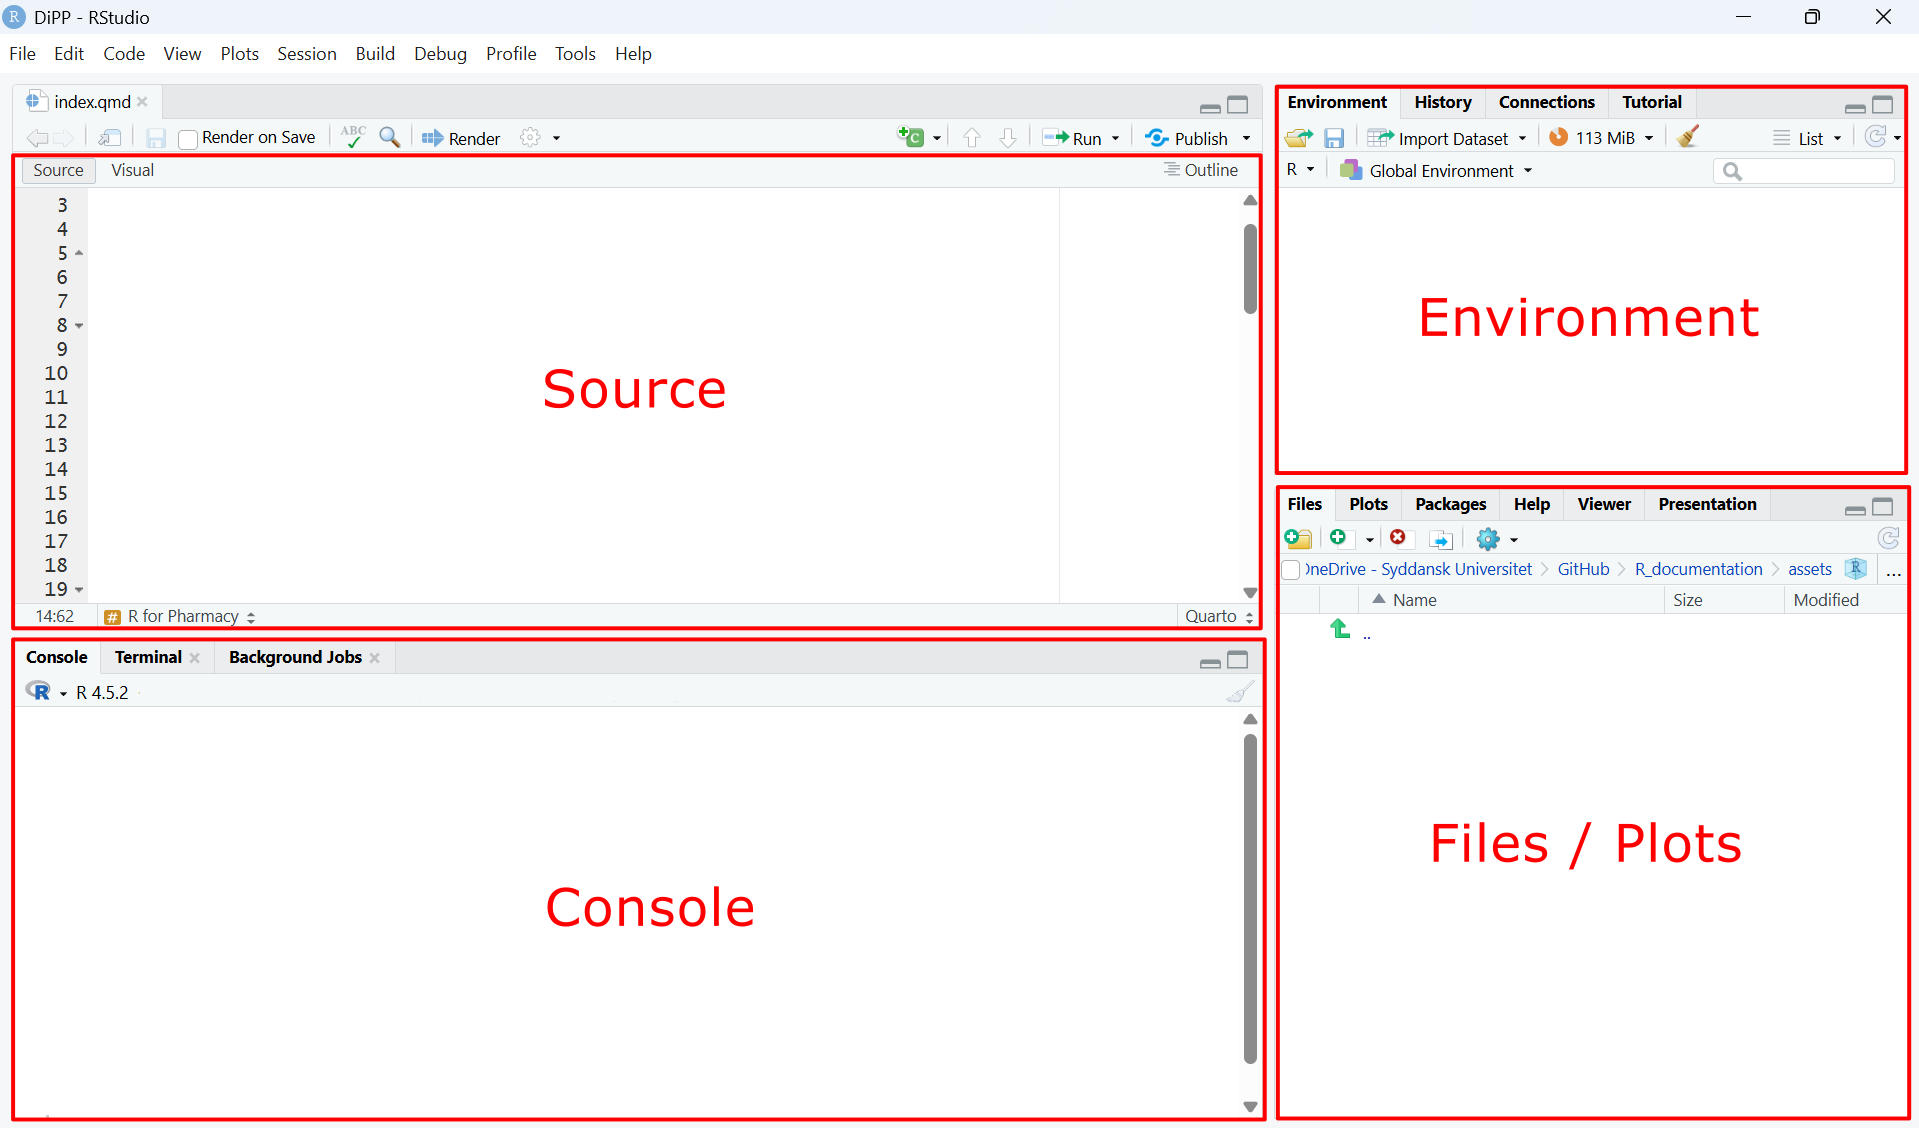
When you open RStudio you will see four panes:
| Pane | Purpose |
|---|---|
| Source (top-left) | Write and save R scripts (files you write your code in) |
| Console (bottom-left) | Run code and see output |
| Environment (top-right) | See all objects currently in memory |
| Files / Plots (bottom-right) | Browse files, view plots, read help pages |
At first, the Source pane may be empty or not visible yet. That is normal: the Source pane shows script files, so you need to create or open one before it appears (see the next section).
For a detailed explanation watch: RStudio in 3 minutes (YouTube) ↗
Libraries / Packages
Packages are bundles of extra functions that extend what R can do. You download them once from CRAN (R’s central repository) and they’re stored locally in your library folder. The packages used throughout this site are mostly part of the tidyverse, a set of packages designed for data science.
Installing packages
Install packages once from CRAN using install.packages().
You install a package when you need functions it provides. Most functions you will need in the beginning are included in the tidyverse, so you can usually just install the tidyverse:
install.packages("tidyverse")You only need to do this once per computer. So instead of writing it in your script and run the install every time you run your script, you can also execute the install in the console.
Loading packages
At the top of every script, load the packages you need with library(). This tells R which installed packages to make available in the current session.
library(tidyverse)
Note
Packages only need to be installed once, but must be loaded (library()) at the start of every new R session.
Creating and saving a script
Your R code lives in script files (ending in .R). A script is a plain-text record of your commands that you can save, re-run, and share.
To create one in RStudio, go to File → New File → R Script. This opens an empty file in the Source pane (top-left). Save it with a meaningful name (for example my_first_script.R) using File → Save or Ctrl+S / Cmd+S.
Good beginner habit: write your code in the Source pane and run it from there, rather than typing everything directly in the Console. This gives you a saved, reusable record of your work.
TipOrganizing your files
This covers making a single script. For a clean folder structure that keeps your scripts, data, and results together, see Setting Up an R Project.
Running your first command
The Console vs. scripts
There are two places to run code in RStudio:
- Console (bottom-left) — type a command, press Enter, and R answers immediately. Great for quick tries and one-off calculations.
- Source / scripts (top-left) — write code, save it, and run it line by line. Use this for work you want to keep.
To run a line from a script, place the cursor on it (or select several lines) and press Ctrl+Enter (Windows) / Cmd+Enter (Mac). The result appears in the Console. As you run code, created objects appear in the Environment pane and plots appear in the Plots tab.
Try it
Print a message with print():
R is also a powerful calculator:
Store a value in an object with <-, then use it:
Running a line that is just an object’s name prints its current value — a quick way to check a result.
Note
Want to understand objects, data types, operators, and output in more depth? That is covered next in R Basics.
Learning Path Recommendations
New to R? Here is a suggested order to work through this site.
Start with the basics
- Getting Started (this page) — set up R and run your first commands.
- R Basics — objects, data types, operators, and how R computes and shows results.
- Setting Up an R Project — organize your files for reproducible work.
Core data skills
- Data Types and Data Structures — understand R value types, data organization, and indexing with practical examples.
- Data Handling — import spreadsheets and tidy real data.
- Pipe Operator (%>%) — chain steps into readable pipelines.
- Math Operations — arithmetic and math functions.
Analyse and present
- Descriptive Statistics — summarise your data.
- Visualization — plot with ggplot2.
- Linear Regression — fit and interpret straight-line models.
Keep these handy throughout
- Error Handling and Debugging — whenever you get stuck on an error.
- R Coding Conventions — write clean, consistent code from the start.
Tip
Browse the function reference any time to look up a specific function.